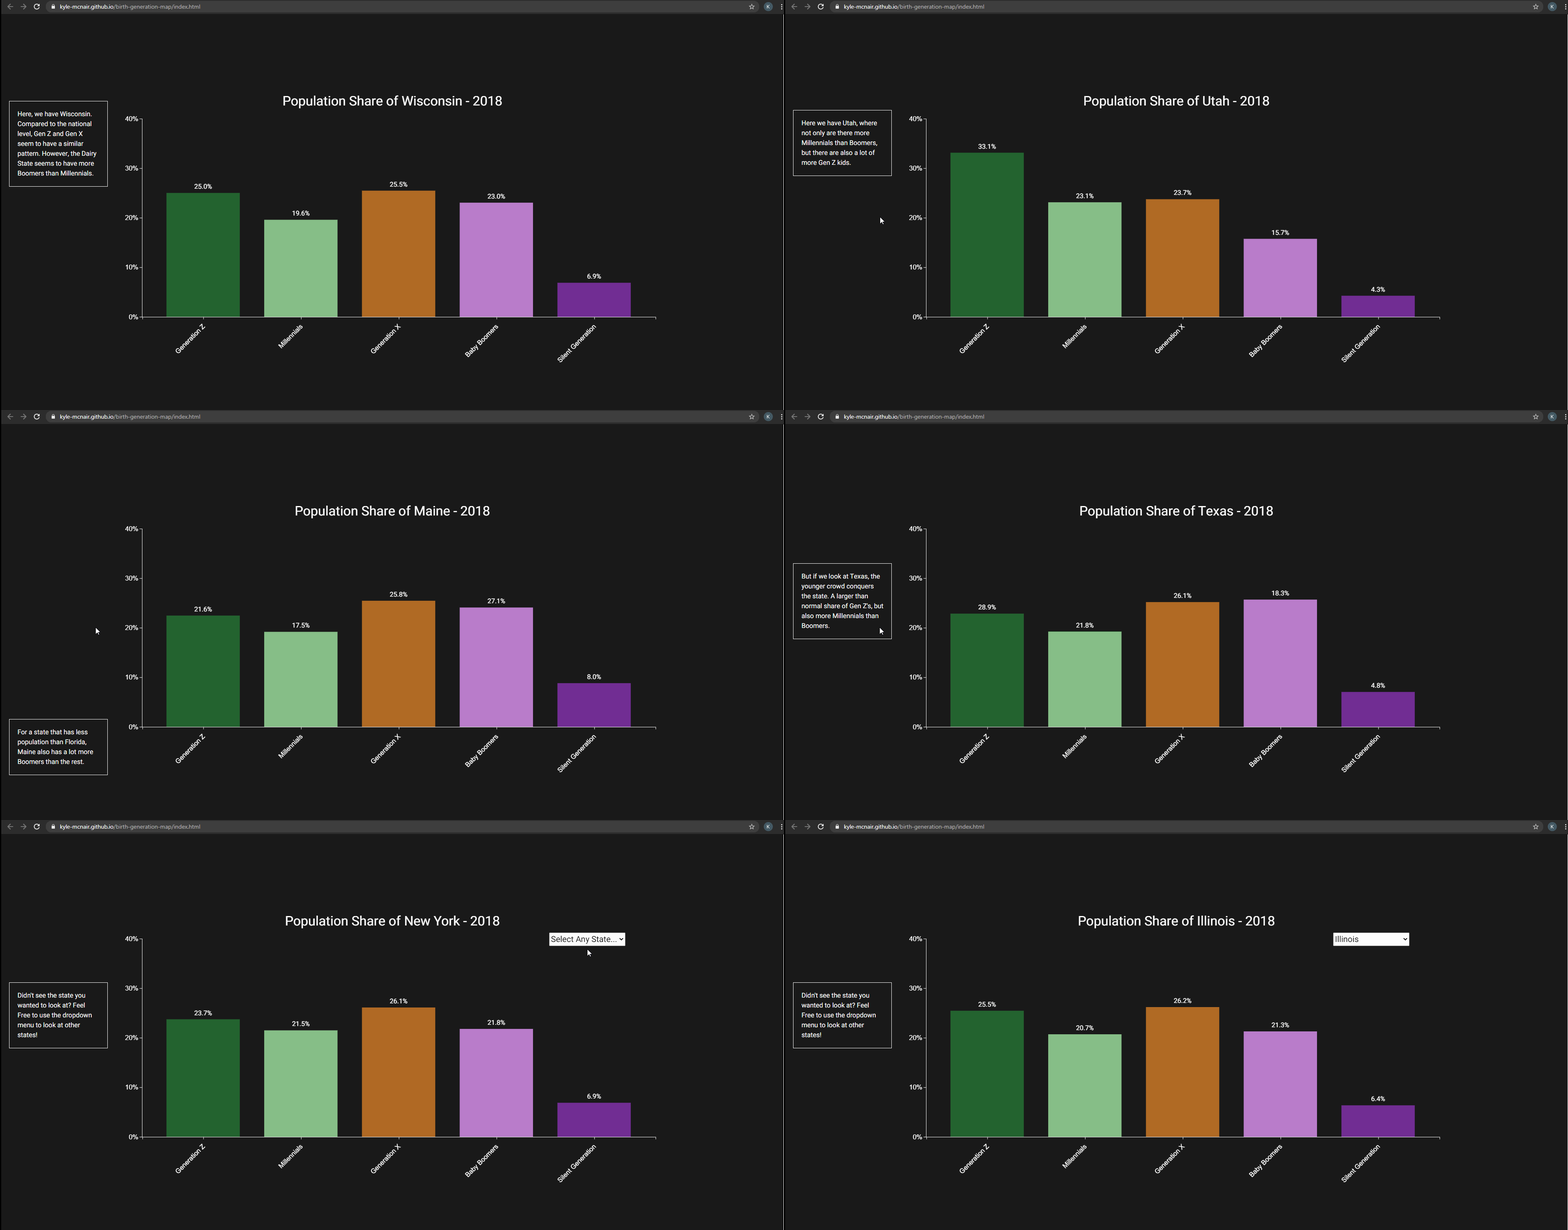
Barplot Scroll Example

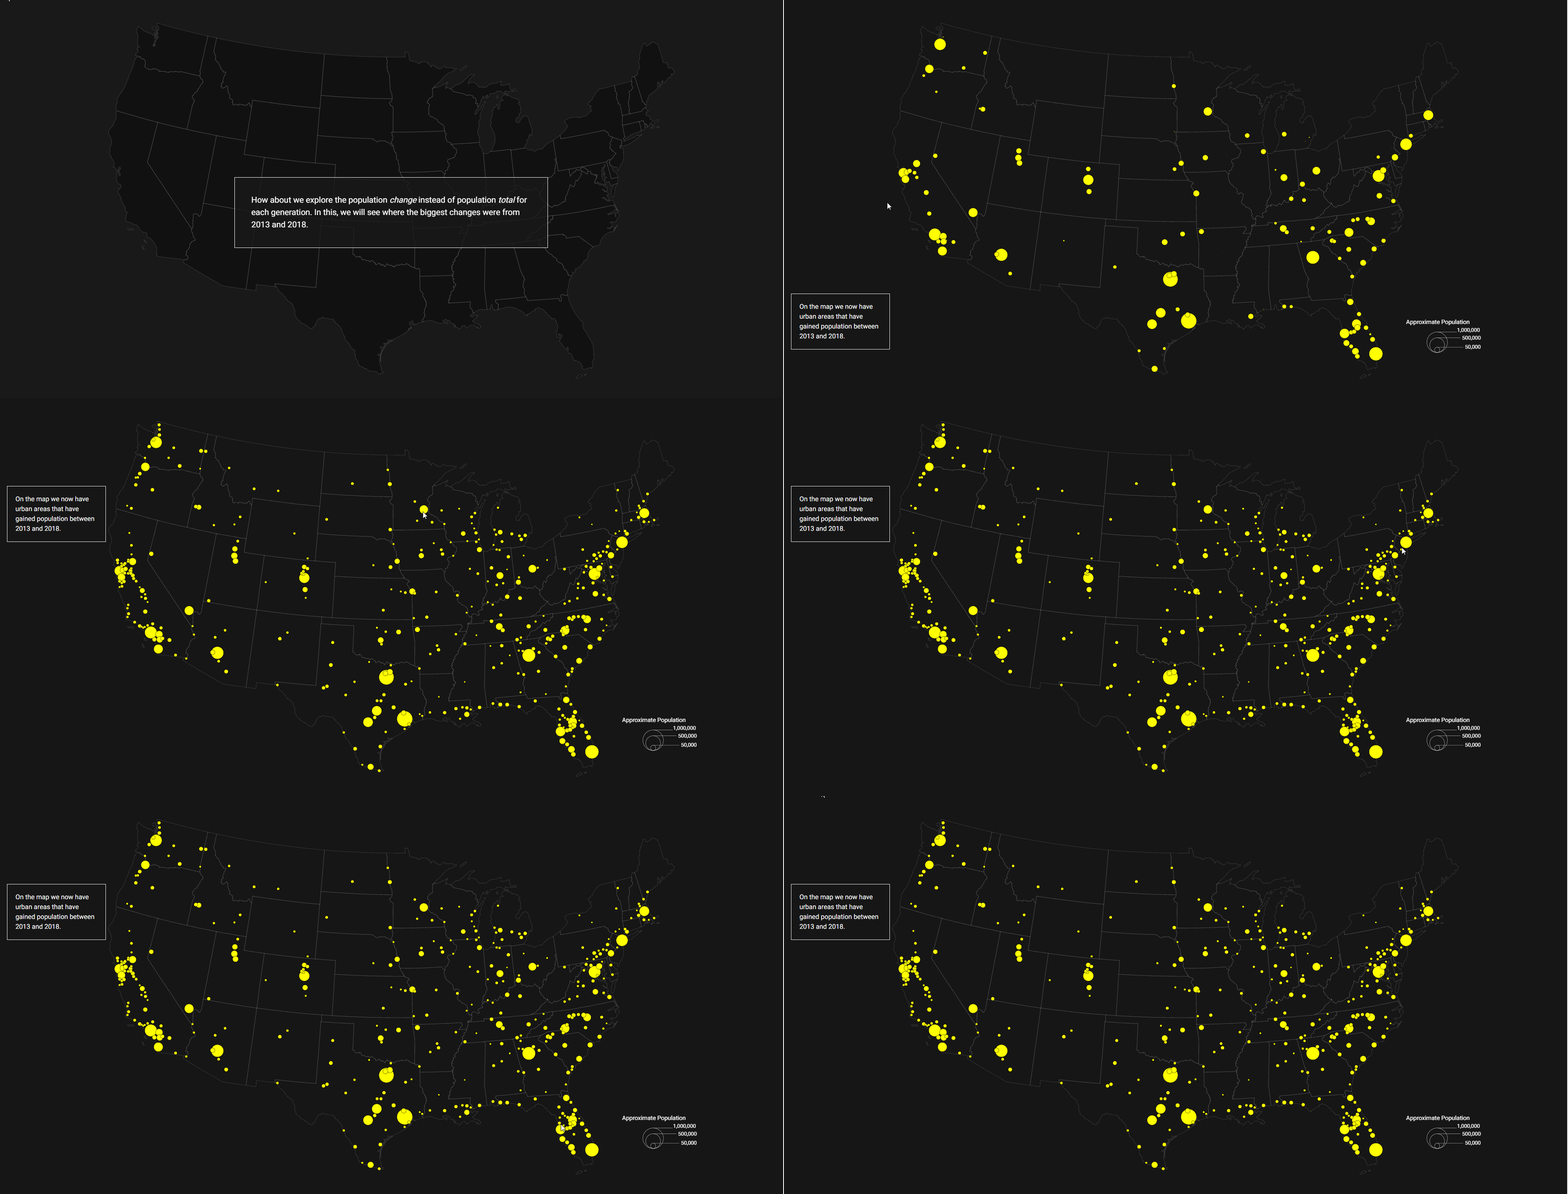
Proportional Symbol Example

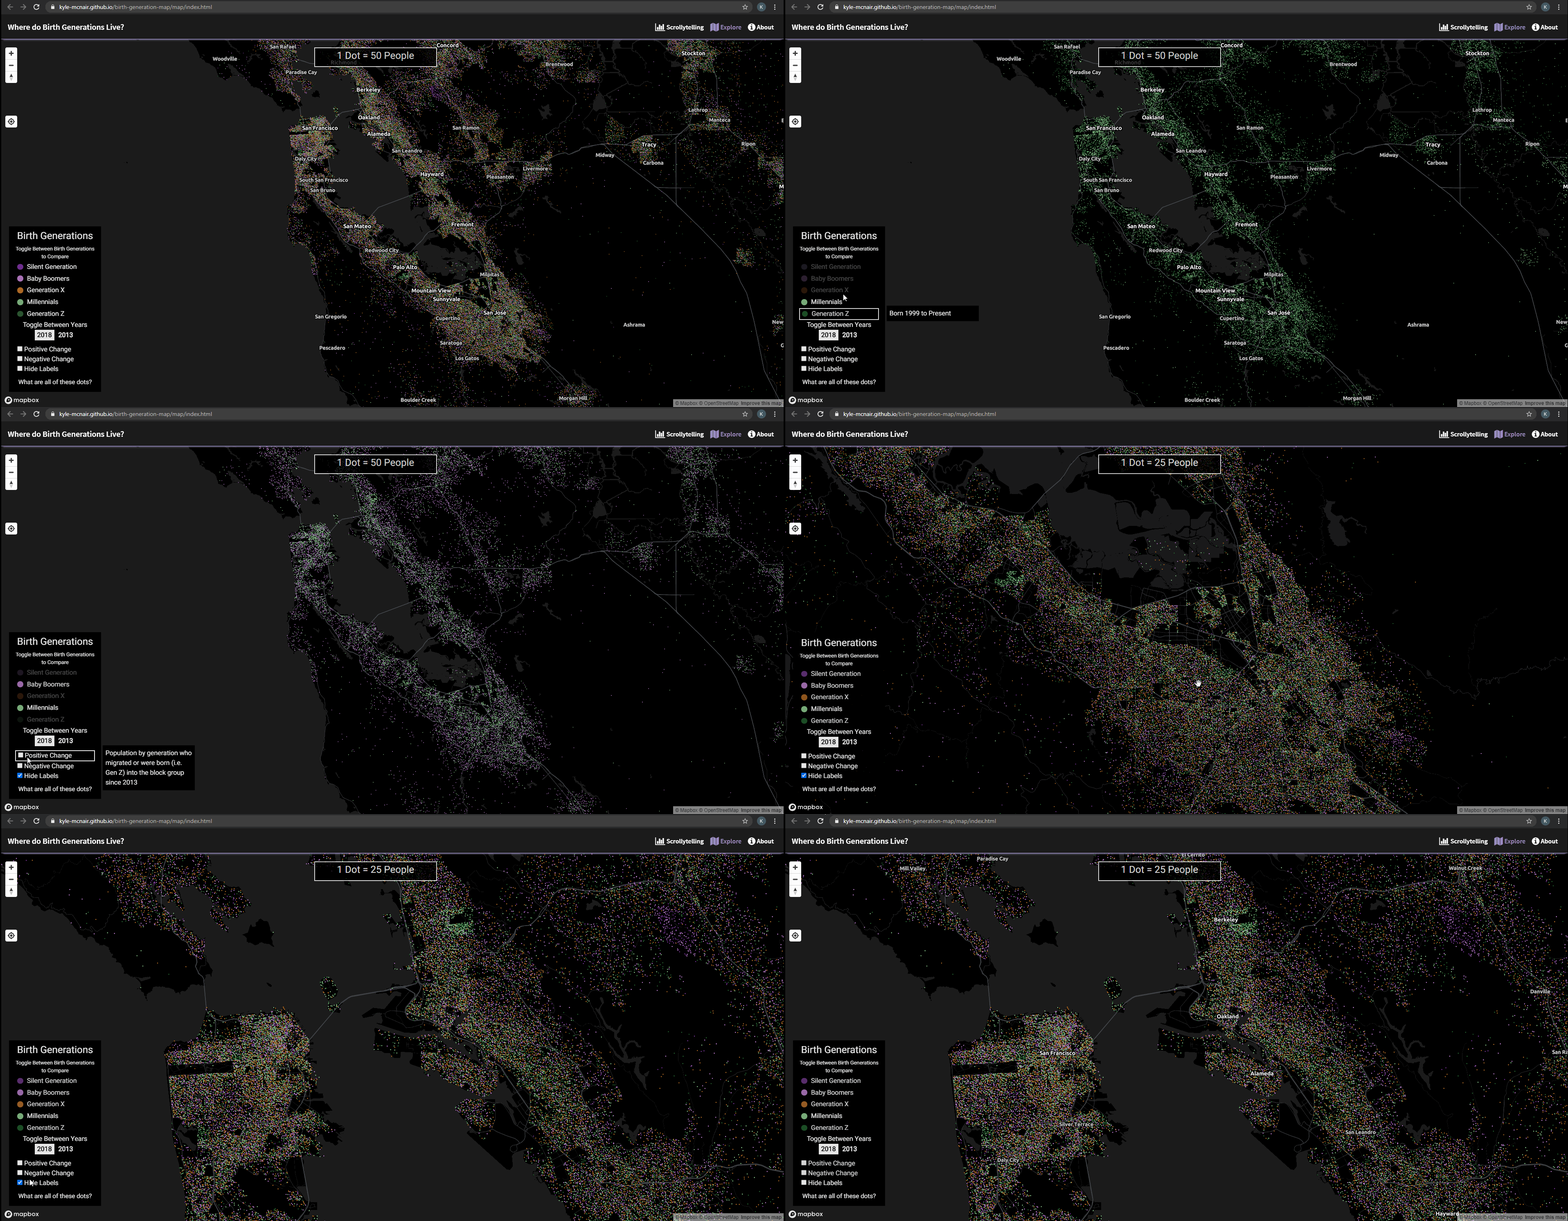
Dot Density Map Example

For my final practicum at UW-Madison, I dedicated my project based on the location of birth generations. Using U.S. Census data, I compared the
the population of 5 birth generations (Silent Generations, Baby Boomers, Generation X, Millennials, and Generation Z) to see what places around the country have the highest share of each birth generation.
One portion of the project is a scrollytelling page that explains the topic and gives the user the ability to explore certain locations and retrieve information. The other page
is a dot density map that was calculated in Python, but later converted to vector tiles using Mapbox's Tippecanoe tool. The purpose of this project was to have users see a trend of older
birth generations living outside of central city area, while younger generations are living closer to the cities. The site is both desktop and mobile friendly.
To view the scrollytelling, click here.
To view the interactive map, click here.
Bootstrap, Scrollama, Python, D3, jQuery, and Mapbox GL were used to develop the site.


